AI and Logics
Use this page when an NPC is alive in game but its scheme, planner, relation, or animation state does not match what you expect.
Start with the in-game overlays when you need visual context. Switch to log dumps when you need the exact script state or GOAP action IDs.
Capturing an NPC
NPC capture is an engine debug feature. It is useful when you need to inspect the world from the NPC perspective.
- Run the game with a mixed or debug engine build.
- Hold left
Alt. - Click the NPC.
The camera switches to the captured object. Release the capture before continuing normal gameplay testing.
AI Overlays
Enable stalker and monster overlays from the console:
ai_dbg_stalker on
ai_dbg_monster on
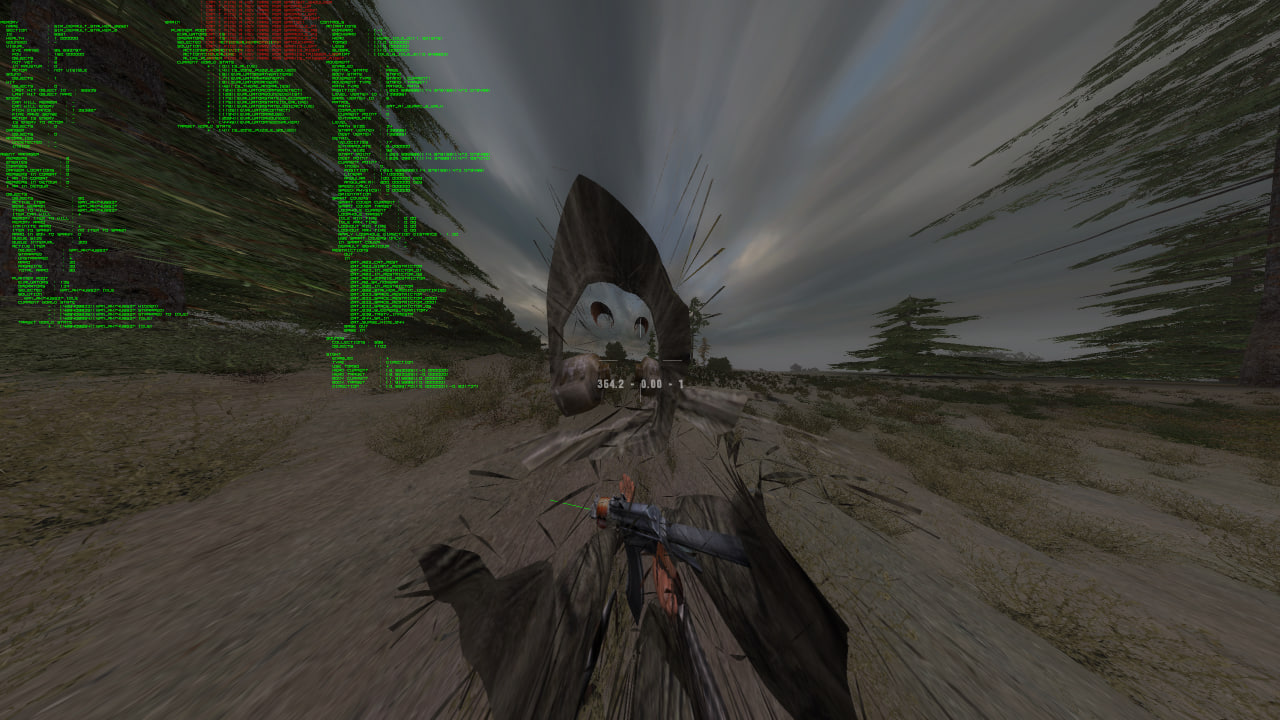
ai_dbg_stalker on renders debug details for stalker objects:
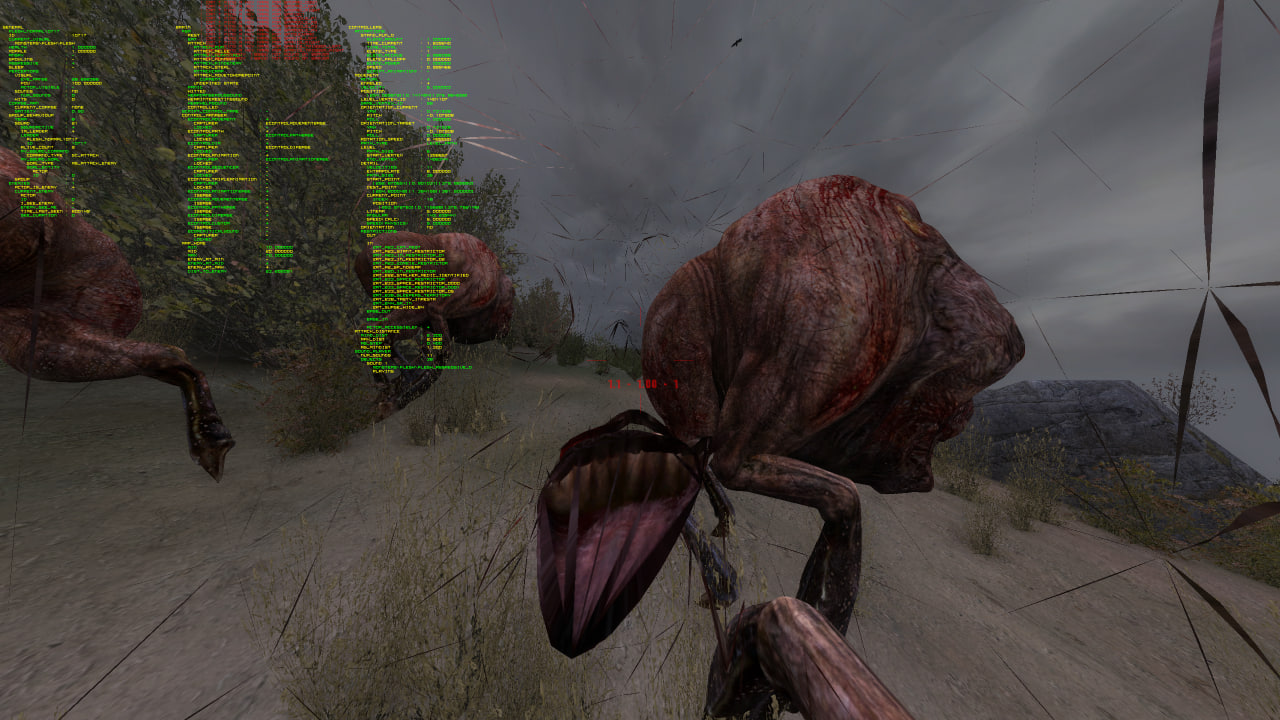
ai_dbg_monster on renders debug details for monster objects:
Use the matching off command to hide each overlay.
Planner and Scheme Logs
The XRF debug panel can print the selected object’s script state to the log. Open the main menu, press F11, switch to
the object section, then choose one of the log buttons.
The object section can print:
- the active scheme, active section, logic section, smart terrain, enemy, portable store, and scheme-specific state;
- the engine action planner and the XRF state planner action IDs;
- the state manager target state, current animation state, animstate, look target, combat flag, and ALife flag;
- inventory contents, best weapon, best item, and relation data.
Planner show(...) output is only available when the engine exposes it. If the log says to run in mixed or debug mode,
restart with a debug-capable engine build and repeat the dump.
Performance Stats
Use engine stats when you need frame-level AI cost, not a script-level dump:
rs_stats on
ai_stats on
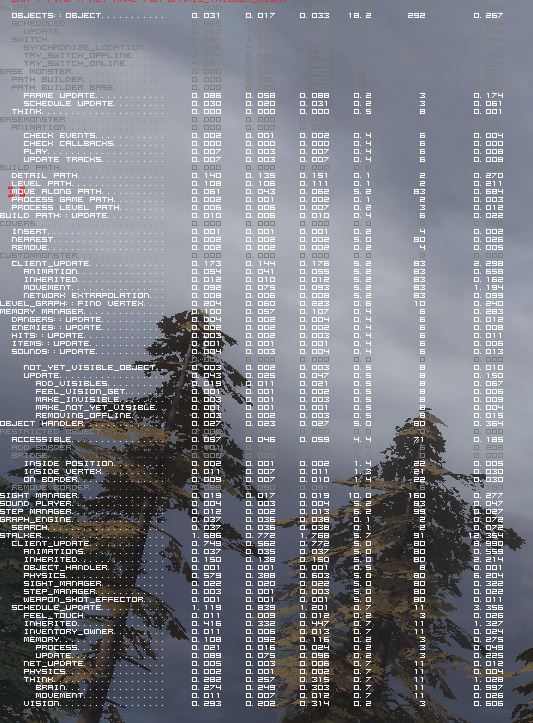
The AI stats overlay shows rows in this shape:
[name][min_time][avg_time][max_time][call_rate][call_count][total_time]
For Lua call profiling, use the XRF debug panel general section. It can start or stop the ProfilingManager, print
hooked call counts, print manually marked profiling portions, show Lua memory use, and force Lua garbage collection.
Run Lua profiling with -nojit when you need cleaner call stats. The profiler logs a warning when LuaJIT is enabled
because JIT compilation can change the measured call pattern.
Useful Console Commands
Common AI debug toggles are listed in the game engine command reference: